How did the regulatory structure of the exchanges evolve?
"The market's upward momentum reflects a broader economic trajectory that has shaped the financial landscape of Vietnam over recent years."
This overview examines the context of recent market movements within the Vietnamese financial landscape. It addresses the historical foundations of the exchanges, the economic growth driving investor interest, and the specific trading mechanics that govern price movements.

Key takeaways: 1. Historical exchange transformations established the current regulatory framework. * Strong GDP growth in 2025 and 2026 provides a macro backdrop for market activity. * Specific daily price limit mechanisms govern volatility on different exchange platforms.
How did the regulatory structure of the exchanges evolve?
The transition from trading centers to formal stock exchanges created the modern framework for Vietnamese capital markets. This evolution began with the transformation of the Ho Chi Minh City Securities Trading Center into the Ho Chi Minh Stock Exchange in 2007 under decision 599/2007/QD-TTg.
At that time, the exchange operated with an initial charter capital of VND 1,000 billion, with the Ministry of Finance acting as the owner.
This structural shift ensured that the various trading hubs could operate under a unified regulatory umbrella.
This Vietnam stock analysis guide explains how both the Hanoi and Ho Chi Minh stock exchanges became subsidiaries with 100% of their charter capital owned by the Vietnam Stock Exchange, reflecting current stock price trends.
This consolidation aimed to streamline market operations across the country.
The Hanoi Stock Exchange (HNX) itself has its own history, having transitioned from the Hanoi Securities Trading Center in 2009. These changes provided the legal stability required for much larger market capitalizations to develop over time.
What economic factors influence Vietnam stock record highs?
Strong macroeconomic performance serves as a primary driver for investor sentiment and market valuation. According to World Bank data, Vietnam recorded GDP growth of 8.0% in 2025.
This significant expansion creates a fertile environment for domestic and international capital to flow into local equities.
The momentum continued into the following year, providing a backdrop for Vietnam stocks to reach new 52-week highs. According to the International Monetary Fund (IMF), Vietnam recorded real GDP growth of 8.4% in 2026.
Such robust growth rates often correlate with increased trading volumes and shifts in market leadership.
When evaluating Vietnam stock record highs, investors often look at these growth figures to gauge the sustainability of market trends. The interplay between industrial output and consumer spending remains a vital component of this economic narrative.
How do price limits affect Vietnam market top gainers?
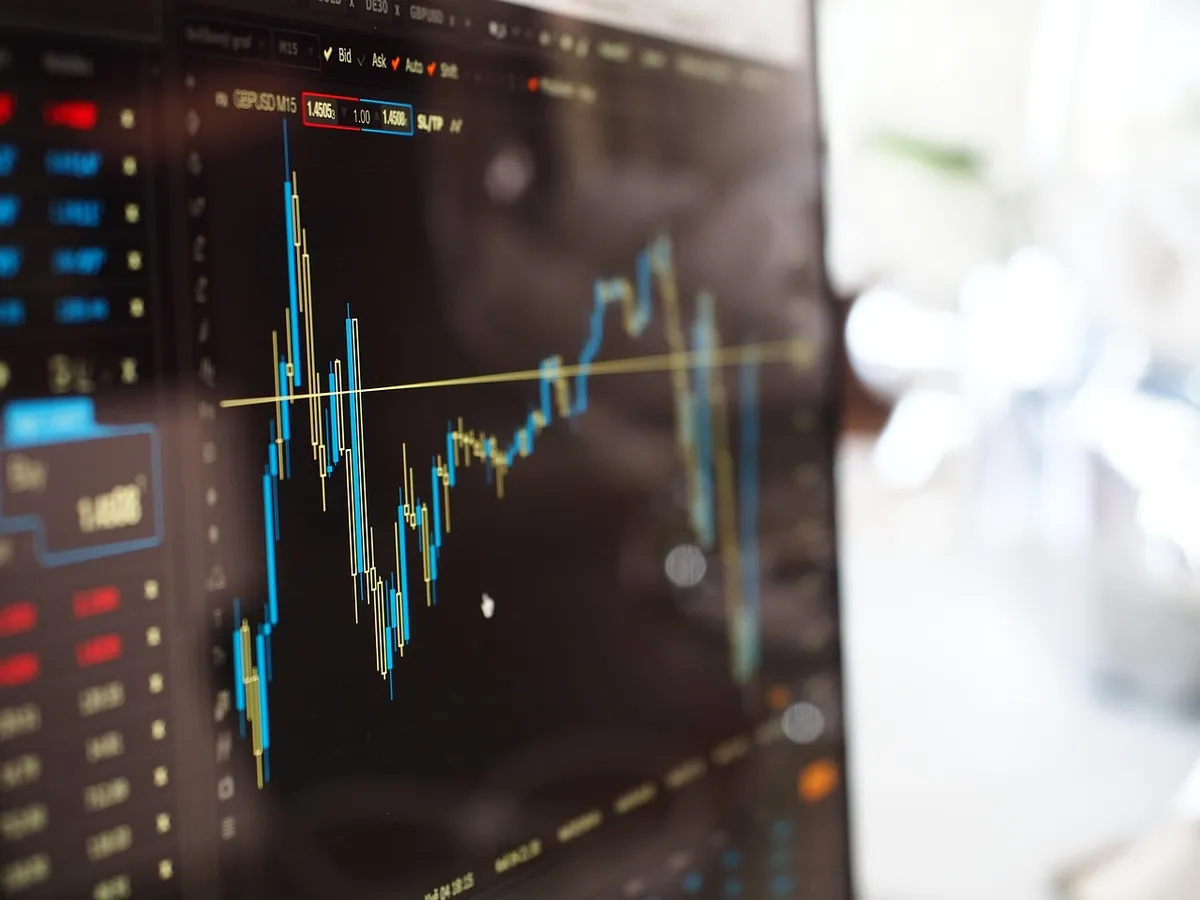
Trading rules on different exchanges dictate how much a stock's price can move in a single day. For example, trading on HNX operates with daily price limit mechanisms where a 10% fluctuation limit applies to regular stocks.
This limit can extend to 30% for newly listed stocks or stocks resuming trading after suspension for more than 25 days.
These mechanisms are designed to manage volatility while allowing for price discovery. For the UPCoM market, the limit is normally 15% and can reach 40% on the first trading day or upon resumption after suspension.
These varying thresholds mean that different asset classes experience different levels of volatility.
Understanding these limits is essential when analyzing top gainers. A stock hitting a limit may indicate strong buying pressure or a sudden reaction to news, depending on the specific exchange rules in place.
According to the International Monetary Fund, Vietnam recorded real GDP growth of 8.4% in 2026.
What is the investment strategy guide for managing volatility in Vietnam?
An effective investment strategy in Vietnam requires an understanding of both macro trends and micro-level trading rules. Investors must balance the pursuit of high growth with the reality of daily price limits.
- Monitor macroeconomic indicators: Keep a close eye on GDP growth rates to understand the broader economic health. 2. Understand exchange-specific rules: Recognize that price limits vary between HNX and UPCoM, affecting how quickly a position can be exited or entered. 3. Verify listing status: Check if a stock is newly listed or resuming trade, as these often have higher volatility thresholds.
A final check involves verifying the specific exchange where a stock is listed to ensure the correct volatility parameters are applied. While high growth provides opportunity, the structural limits of the exchanges act as a necessary brake on extreme fluctuations.
What are the limitations of analyzing market highs?
A limitation of using historical growth data to predict future stock performance is that macro statistics do not account for individual company health or specific sector risks.
While the 8.4% real GDP growth in 2026 is a significant figure, it represents an aggregate measure rather than a guarantee of individual stock success.
| Metric | 2025 Growth | 2026 Growth |
|---|---|---|
| GDP Growth Rate | 8.0% | 8.4% |
The table above shows the progression of growth as reported by international organizations. These figures provide a sense of scale but do not reflect the real-time volatility of individual tickers.
Wikipedia: Hanoi Stock Exchange
- How did the regulatory structure of the exchanges evolve?
- What economic factors influence Vietnam stock record highs?
- How do price limits affect Vietnam market top gainers?
Related
- Vietnam agriculture rainfall drop: Tips for better water use
- Weather tomorrow alert: Vietnam weather tomorrow alert guide
How do the different exchange rules affect the market's upward trajectory? Different exchange rules dictate the permissible movement of stock prices, which influences the overall market's upward momentum. For instance, the 10% limit on regular HNX stocks provides a baseline for daily movement, contrasting with the 15% standard for UPCoM stocks. This difference in daily fluctuation thresholds means that the speed at which a stock can contribute to the market's upward trend varies across platforms.
When a stock approaches a limit, it signals a point where buying pressure is exerting significant force, which is a condition that can accelerate the market's upward movement.
Conversely, adherence to these limits prevents any single stock from causing an instantaneous, uncontrolled spike in the market.
Investors must compare the volatility profiles of HNX versus UPCoM when assessing the market's upward potential. The varying limits serve as a structural constraint on the speed of the upward movement, even when macroeconomic factors are strongly positive.








Comments 0